Menu
Facts & Figures
Following are the statistics pertaining to the credit disbursed till date.
Portfolio Reports
| Ratio |
March-2026 |
|---|---|
| Operating Cost Ratio | 7.66% |
| Total Cost Ratio | 21.27% |
| Operating Self Sufficiency | 108.81% |
| Yield on Portfolio | 21.28% |
| Return on Assets | 1.15% |
| Return on Equity | 9.78% |
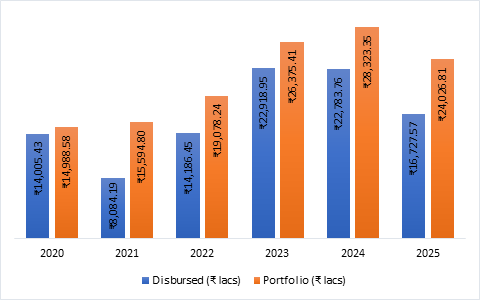
| Year | Loan Disbursement (Rs. In Lakh) |
Total Portfolio (Rs. In lakh) |
|---|---|---|
| March -2026 | 5424.43 | 14563.89 |
District Wise SHGs and Members
The Total Portfolio district wise details of SHGs formed as on 31st March 2026
| Sl. No. | Districts | No. of SHGs |
|---|---|---|
| 01 | Bagalkot | 191 |
| 02 | Ballari | 335 |
| 03 | Belgaum | 2,899 |
| 04 | Chikkamagaluru | 98 |
| 05 | Chitradurga | 191 |
| 06 | Davanagere | 56 |
| 07 | Dharashiv | 311 |
| 08 | Dharwad | 4,194 |
| 09 | Gadag | 242 |
| 10 | Haveri | 1,155 |
| 11 | Jogulamba Gadwal | 63 |
| 12 | Kalburgi | 357 |
| 13 | Kolhapur | 505 |
| 14 | Koppal | 125 |
| 15 | Latur | 446 |
| 16 | North Goa | 423 |
| 17 | Pune | 207 |
| 18 | Raichur | 893 |
| 19 | Ratnagiri | 42 |
| 20 | Sangli | 660 |
| 21 | Shimoga | 445 |
| 22 | Sindhudurg | 141 |
| 23 | Solapur | 2,469 |
| 24 | South Goa | 139 |
| 25 | Sri Sathya Sai | 179 |
| 26 | Tumkur | 947 |
| 27 | Uttara Kannada | 470 |
| 28 | Vijayanagar | - |
| 29 | Vijayapura | 1,121 |
| 30 | Yadgir | 400 |
| Total | 19,704 | |
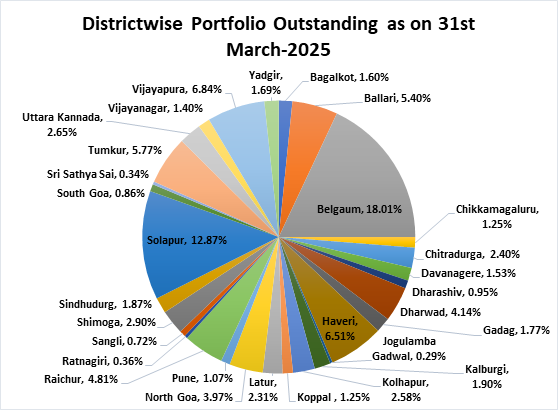
No. of Accounts and OS Bal. as of 31st March 2026 (Total Portfolio)
| Sl. No. | State | Districts | No. of A/c. | OS Balance | Percentage |
|---|---|---|---|---|---|
| 01 | Andhra Pradesh | Sri Sathya Sai | 460 | 153 | 1.05% |
| 02 | Goa | North Goa | 1,473 | 341 | 2.34% |
| 03 | Goa | South Goa | 411 | 88 | 0.60% |
| 04 | Karnataka | Bagalkot | 900 | 262 | 1.80% |
| 05 | Karnataka | Ballari | 3,363 | 1,180 | 8.10% |
| 06 | Karnataka | Belgaum | 6,405 | 2,016 | 13.84% |
| 07 | Karnataka | Chikkamagaluru | 620 | 228 | 1.56% |
| 08 | Karnataka | Chitradurga | 1,328 | 451 | 3.10% |
| 09 | Karnataka | Davanagere | 831 | 342 | 2.35% |
| 10 | Karnataka | Dharwad | 2,710 | 859 | 5.90% |
| 11 | Karnataka | Gadag | 885 | 277 | 1.90% |
| 12 | Karnataka | Haveri | 2,842 | 981 | 6.74% |
| 13 | Karnataka | Kalburgi | 1,095 | 282 | 1.94% |
| 14 | Karnataka | Koppal | 635 | 213 | 1.46% |
| 15 | Karnataka | Raichur | 2,219 | 620 | 4.25% |
| 16 | Karnataka | Shimoga | 1,562 | 491 | 3.37% |
| 17 | Karnataka | Tumkur | 3,039 | 989 | 6.79% |
| 18 | Karnataka | Uttara Kannada | 1,396 | 393 | 2.70% |
| 19 | Karnataka | Vijayanagar | 957 | 306 | 2.10% |
| 20 | Karnataka | Vijayapura | 3,137 | 805 | 5.53% |
| 21 | Karnataka | Yadgir | 928 | 246 | 1.69% |
| 22 | Maharashtra | Dharashiv | 700 | 144 | 0.99% |
| 23 | Maharashtra | Kolhapur | 1,780 | 411 | 2.82% |
| 24 | Maharashtra | Latur | 1,214 | 237 | 1.62% |
| 25 | Maharashtra | Pune | 759 | 151 | 1.04% |
| 26 | Maharashtra | Ratnagiri | 218 | 44 | 0.30% |
| 27 | Maharashtra | Sangli | 803 | 172 | 1.18% |
| 28 | Maharashtra | Sindhudurg | 1,040 | 190 | 1.31% |
| 29 | Maharashtra | Solapur | 7,495 | 1,607 | 11.03% |
| 30 | Telangana | Jogulamba Gadwal | 283 | 85 | 0.58% |
| Total | 51,488 | 14,564 | 100.00% | ||
No. of Accounts and OS Bal. as of 31st March 2026 (Total Portfolio)
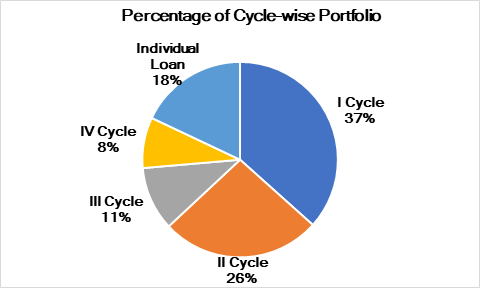
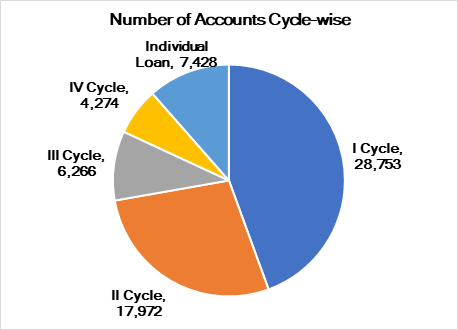
Total Loan Products as of 31st March 2026
| Sl. No. | Product | No. of A/c. | Amt. (Lakh) | Percentage(%) |
|---|---|---|---|---|
| 01 | I Cycle | 14,441 | 3,029.18 | 26.14% |
| 02 | II Cycle | 12,788 | 3,230.16 | 27.87% |
| 03 | III Cycle | 6,644 | 1,887.51 | 16.28% |
| 04 | IV Cycle | 4,016 | 1,296.31 | 11.18% |
| 05 | Individual Loan | 4,870 | 1,831.65 | 15.80% |
| 06 | Digital Loans | 1,041 | 316 | 2.72% |
| 07 | Owned Portfolio | 43,800 | 11,590 | 100% |
| 08 | Managed Portfolio | 7,688 | 2,973.41 | 100% |
| 09 | Total Portfolio | 51,488 | 14,564 | 100% |